![]() The recent weeks I have been playing around with grails. When working with grails you have to learn groovy as well. Sometimes I am just amazed by the easiness of doing things with groovy. That is why I started out using groovy for a very small project (at least with groovy) to analyze an xml file as generated by the performance measurement framework Beet.
The recent weeks I have been playing around with grails. When working with grails you have to learn groovy as well. Sometimes I am just amazed by the easiness of doing things with groovy. That is why I started out using groovy for a very small project (at least with groovy) to analyze an xml file as generated by the performance measurement framework Beet.
In this blog post I go step-to-step through a solution that analyzes the xml file and plots the results in a chart generated with jfreechart.
Introduction
 In one of my previous posts I have discussed a nice framework for easy performance measurement called Beet. You can find this post here: Using beet to monitor your (springframework) application. The result of a monitor session with beet can be an xml file. Nice, but how do you analyze this file? By hand? No way, you need a tool. Excel or Numbers can be fine, but it can be a lot faster. Therefore I decided to create a small groovy application.
The first requirement for me was very easy, read the events in the xml file and calculate the average of all events of a certain type. I asked a few of my collegues about their estimated effort when having to do it in java. They varied from 1 hour (pretty optimistic) to half a day. Curious how much time it took me?
First iteration
The first iteration was to calculate the overall average, an optimist of 2 hour java work. First you locate the file, than you slurp the xml out of the file. With the xml file in your hand, you obtain all events with a child element type with the value method. The following code block shows these three lines of code, yes for real, three lines.
def file = new File("beet-integration-web-perf.xml")
def xml = new XmlSlurper().parse(file)
def methodEvents = xml.event.findAll {it.type == "method"}
The next step is to take all durations from the found events. Using these durations, calculating the average is very easy.
def file = new File("beet-integration-web-perf.xml")
def xml = new XmlSlurper().parse(file)
def methodEvents = xml.event.findAll {it.type == "method"}
def durations = methodEvents*."duration-ms"
println "Average duration is ${durations.sum {it.toBigDecimal()} / durations.size()}"
That is it, this took me 10 minutes. And yes for 5 lines of code that is still a lot, but cut me some slag man, I am still learning groovy 🙂 . What I forgot to mention is that I use the groovyConsole to create and run the application.
Second iteration
The total average is nice, but with hundreds of measurements, not very useful. Of course we want more information on the data. To stretch myself a little bit, I had the idea to take the average of each minute and print that on screen. The next code block does just that, it calculates the averages of all measurements in the same minute and prints the result on the screen. When reading the code, take this tip. We create an array with all durations for each minute and put the result in a map with the minute as a key and the array with durations as a value.
def averages = [:]
def start = methodEvents[0].start.text()[0..16]
def minuteItems = []
methodEvents.each {
    def duration = it."duration-ms".toBigDecimal()
    def currentStart = it.start.text()[0..16]

    if (start == currentStart) {
        minuteItems.add duration
    } else {
        averages.put ((start),minuteItems)
        minuteItems = [duration]
        start = currentStart
    }
}

averages.each {key,value ->
    println "Minute : ${key} has average duration of ${value.sum {it.toBigDecimal()} / value.size()}"
}
Third and final iteration
Having this data written to the screen is oke, but a nice graph would be even better. For this I used a sample I found via google. Since the code is pretty straightforward, I just copy it in here.
def dataset = new DefaultCategoryDataset()
dataset.with{
avarages.each {key,values ->
def value = (values.sum {it.toInteger()} / values.size())
addValue value , "average", key[-3..-1]
}
}
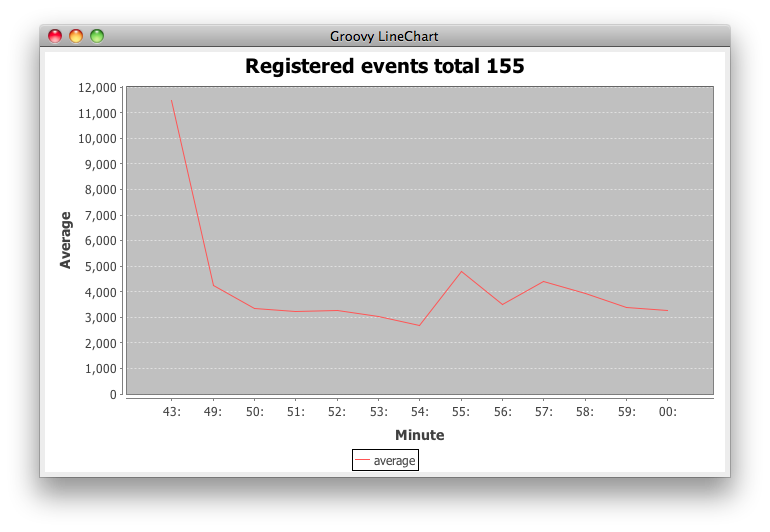
def labels = ["Registered events total ${methodEvents.size()}", "Minute", "Average"]
def options = [true, true, true]
def chart = ChartFactory.createLineChart(*labels, dataset,Orientation.VERTICAL, *options)
def swing = new SwingBuilder()
def frame = swing.frame(title:'Groovy LineChart',
defaultCloseOperation:WC.EXIT_ON_CLOSE) {
panel(id:'canvas') { widget(new ChartPanel(chart)) }
}
frame.pack()
frame.show()
For those java people, check the way you can work with arrays in line 5. Counting from the end of the array, nice.
The result is shown in the next image.
That is about it, just two last things. First you need to add two jars to the classpath of groovy: jcommon-1.0.16.jar, jfreechart-1.0.13.jar. These are in the jfreechart download package. I used the mechanism to create a folder .groovy/lib in your root and add the jars to that folder.
The other thing I wanted to mention is the option to create a shell script from groovy. Just add the following line at the top and make your file executable and you are good to go.
#!/usr/bin/env groovy
That is it, in total 2 hours of work, not bad I think for a beginner in groovy with access to google. If you are good at groovy and you spot improvements, please let me know, I am eager to learn more.
Pingback:Gather content for Lucene from Wordpress using Groovy « JTeam Blog / JTeam: Enterprise Java, Open Source, software solutions, Amsterdam
Hi,
Nice tutorial about groovy.
However, I think you need to explain how the xml file looks like.
What are the magic numbers 0..16?
By the way, I saw that there’s a typo in your code. It should be “duration-ns” instead of “duration-ms”?
http://beet.sourceforge.net/documentation/tutorial?start=3
Thanks,