
How often do you start creating a new application? How often have you thought about configuring an application. Where to locate a config file, how to load the file, what format to use? Another thing you regularly do is adding timers to track execution time, management tools to do thread analysis etc. From a more functional perspective you want a rich client side application using angularjs. So you need a REST backend to deliver json documents. Does this sound like something you need regularly? Than this blog post is for you. If you never need this, please keep on reading, you might like it.
In this blog post I will create an application that show you all the available indexes in your elasticsearch cluster. Not very sexy, but I am going to use: AngularJS, Dropwizard and elasticsearch. That should be enough to get a lot of you interested.
What is Dropwizard
Dropwizard is a framework that combines a lot of other frameworks that have become the de facto standard in their own domain. We have jersey for REST interface, jetty for light weight container, jackson for json parsing, free marker for front-end templates, Metric for the metrics, slf4j for logging. Dropwizard has some utilities to combine these frameworks and enable you as a developer to be very productive in constructing your application. It provides building blocks like lifecycle management, Resources, Views, loading of bundles, configuration and initialization.
Time to jump in and start creating an application.
Structure of the application
The application is setup as a maven project. To start of we only need one dependency:
<dependency>
    <groupId>io.dropwizard</groupId>
    <artifactId>dropwizard-core</artifactId>
    <version>${dropwizard.version}</version>
</dependency>
If you want to follow along, you can check my github repository:
https://github.com/jettro/dropwizard-elastic
Configure your application
Every application needs configuration. In our case we need to configure how to connect to elasticsearch. In drop wizard you extend the Configuration class and create a pojo. Using jackson and hibernate validator annotations we configure validation and serialization. In our case the configuration object looks like this:
public class DWESConfiguration extends Configuration {
    @NotEmpty
    private String elasticsearchHost = "localhost:9200";

    @NotEmpty
    private String clusterName = "elasticsearch";

    @JsonProperty
    public String getElasticsearchHost() {
        return elasticsearchHost;
    }

    @JsonProperty
    public void setElasticsearchHost(String elasticsearchHost) {
        this.elasticsearchHost = elasticsearchHost;
    }

    @JsonProperty
    public String getClusterName() {
        return clusterName;
    }

    @JsonProperty
    public void setClusterName(String clusterName) {
        this.clusterName = clusterName;
    }
}
Then you need to create a yml file containing the properties in the configuration as well as some nice values. In my case it looks like this:
elasticsearchHost: localhost:9300
clusterName: jc-play
How often did you start in your project to create the configuration mechanism? Usually I start with maven and quickly move to tomcat. Not this time. We did do maven, now we did configuration. Next up is the runner for the application.
Add the runner
This is the class we run to start the application. Internally jetty is started. We extend the Application class and use the configuration class as a generic. This is the class that initializes the complete application. Used bundles are initialized, classes are created and passed to other classes.
public class DWESApplication extends Application<DWESConfiguration> {
    private static final Logger logger = LoggerFactory.getLogger(DWESApplication.class);

    public static void main(String[] args) throws Exception {
        new DWESApplication().run(args);
    }

    @Override
    public String getName() {
        return "dropwizard-elastic";
    }

    @Override
    public void initialize(Bootstrap<DWESConfiguration> dwesConfigurationBootstrap) {
    }

    @Override
    public void run(DWESConfiguration config, Environment environment) throws Exception {
        logger.info("Running the application");
    }
}
When starting this application, we have no succes. A big error because we did not register any resources.
ERROR [2014-05-14 16:58:34,174] com.sun.jersey.server.impl.application.RootResourceUriRules:
	The ResourceConfig instance does not contain any root resource classes.
Nothing happens, we just need a resource.
Before we can return something, we need to have something to return. We create a pogo called Index that contains one property called name. For now we just return this object as a json object. The following code shows the IndexResource that handles the requests that are related to the indexes.
@Path("/indexes")
@Produces(MediaType.APPLICATION_JSON)
public class IndexResource {

    @GET
    @Timed
    public Index showIndexes() {
        Index index = new Index();
        index.setName("A Dummy Index");

        return index;
    }
}
The @GET, @PATH and @Produces annotations are from the jersey rest library. @Timed is from the metrics library. Before starting the application we need to register our index resource with jersey.
    @Override
    public void run(DWESConfiguration config, Environment environment) throws Exception {
        logger.info("Running the application");
        final IndexResource indexResource = new IndexResource();
        environment.jersey().register(indexResource);
    }
Now we can start the application using the following runner from intellij. Later on we will create the executable jar.
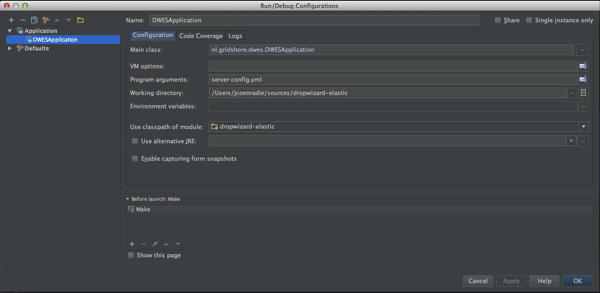
Run the application again, this time it works. You can browse to http://localhost:8080/index and see our dummy index as a nice json document. There is something in the logs though. I love this message, this is what you get when running the application without health checks.
!!!!!!!!!!!!!!!!!!!!!!!!!!!!!!!!!!!!!!!!!!!!!!!!!!!!!!!!!!!!!!!!!!!!!!!!!!!!!!!!
!!!!!!!!!!!!!!!!!!!!!!!!!!!!!!!!!!!!!!!!!!!!!!!!!!!!!!!!!!!!!!!!!!!!!!!!!!!!!!!!
!    THIS APPLICATION HAS NO HEALTHCHECKS. THIS MEANS YOU WILL NEVER KNOW      !
!     IF IT DIES IN PRODUCTION, WHICH MEANS YOU WILL NEVER KNOW IF YOU'RE      !
!    LETTING YOUR USERS DOWN. YOU SHOULD ADD A HEALTHCHECK FOR EACH OF YOUR    !
!         APPLICATION'S DEPENDENCIES WHICH FULLY (BUT LIGHTLY) TESTS IT.       !
!!!!!!!!!!!!!!!!!!!!!!!!!!!!!!!!!!!!!!!!!!!!!!!!!!!!!!!!!!!!!!!!!!!!!!!!!!!!!!!!
!!!!!!!!!!!!!!!!!!!!!!!!!!!!!!!!!!!!!!!!!!!!!!!!!!!!!!!!!!!!!!!!!!!!!!!!!!!!!!!!
Creating a health check
We add a health check, since we are creating an application interacting with elasticsearch, we create a health check for elasticsearch. Don’t think to much about how we connect to elasticsearch yet. We get there later on.
public class ESHealthCheck extends HealthCheck {

    private ESClientManager clientManager;

    public ESHealthCheck(ESClientManager clientManager) {
        this.clientManager = clientManager;
    }

    @Override
    protected Result check() throws Exception {
        ClusterHealthResponse clusterIndexHealths = clientManager.obtainClient().admin().cluster().health(new ClusterHealthRequest())
                .actionGet();
        switch (clusterIndexHealths.getStatus()) {
            case GREEN:
                return HealthCheck.Result.healthy();
            case YELLOW:
                return HealthCheck.Result.unhealthy("Cluster state is yellow, maybe replication not done? New Nodes?");
            case RED:
            default:
                return HealthCheck.Result.unhealthy("Something is very wrong with the cluster", clusterIndexHealths);

        }
    }
}
Just like with the resource handler, we need to register the health check. Together with the standard http port for normal users, another port is exposed for administration. Here you can find the metrics reports like Metrics, Ping, Threads, Healthcheck.
    @Override
    public void run(DWESConfiguration config, Environment environment) throws Exception {
        Client client = ESClientFactorybean.obtainClient(config.getElasticsearchHost(), config.getClusterName());

        logger.info("Running the application");
        final IndexResource indexResource = new IndexResource(client);
        environment.jersey().register(indexResource);

        final ESHealthCheck esHealthCheck = new ESHealthCheck(client);
        environment.healthChecks().register("elasticsearch", esHealthCheck);
    }
You as a reader now have an assignment to start the application and check the admin pages yourself: http://localhost:8081. We are going to connect to elasticsearch in the mean time.
Connecting to elasticsearch
We connect to elasticsearch using the transport client. This is taken care of by the ESClientManager. We make use of the drop wizard managed classes. The lifecycle of these classes is managed by drop wizard. From the configuration object we take the host(s) and the cluster name. Now we can obtain a client in the start method and pass this client to the classes that need it. The first class that needs it is the health check, but we already had a look at that one. Using the ESClientManager other classes have access to the client. The managed interface mandates the start as well as the stop method.
    @Override
    public void start() throws Exception {
        Settings settings = ImmutableSettings.settingsBuilder().put("cluster.name", clusterName).build();

        logger.debug("Settings used for connection to elasticsearch : {}", settings.toDelimitedString('#'));

        TransportAddress[] addresses = getTransportAddresses(host);

        logger.debug("Hosts used for transport client : {}", (Object) addresses);

        this.client = new TransportClient(settings).addTransportAddresses(addresses);
    }

    @Override
    public void stop() throws Exception {
        this.client.close();
    }
We need to register our managed class with the lifecycle of the environment in the runner class.
    @Override
    public void run(DWESConfiguration config, Environment environment) throws Exception {
        ESClientManager esClientManager = new ESClientManager(config.getElasticsearchHost(), config.getClusterName());
        environment.lifecycle().manage(esClientManager);
    }
Next we want to change the IndexResource to use the elasticsearch client to list all indexes.
    public List<Index> showIndexes() {
        IndicesStatusResponse indices = clientManager.obtainClient().admin().indices().prepareStatus().get();

        List<Index> result = new ArrayList<>();
        for (String key : indices.getIndices().keySet()) {
            Index index = new Index();
            index.setName(key);
            result.add(index);
        }
        return result;
    }
Now we can browse to http://localhost:8080/indexes and we get back a nice json object. In my case I got this:
[
	{"name":"logstash-tomcat-2014.05.02"},
	{"name":"mymusicnested"},
	{"name":"kibana-int"},
	{"name":"playwithip"},
	{"name":"logstash-tomcat-2014.05.08"},
	{"name":"mymusic"}
]
Creating a better view
Having this REST based interface with json documents is nice, but not if you are human like me (well kind of). So let us add some AngularJS magic to create a slightly better view. The following page can of course also be created with easier view technologies, but I want to demonstrate what you can do with dropwizard.
First we make it possible to use free marker as a template. To make this work we need to additional dependencies: dropwizard-views and dropwizard-views-freemarker. The first step is a view class that knows the free marker template to load and provide the fields that you template can read. In our case we want to expose the cluster name.
public class HomeView extends View {
    private final String clusterName;

    protected HomeView(String clusterName) {
        super("home.ftl");
        this.clusterName = clusterName;
    }

    public String getClusterName() {
        return clusterName;
    }
}
Than we have to create the free marker template. This looks like the following code block
<#-- @ftlvariable name="" type="nl.gridshore.dwes.HomeView" -->
<html ng-app="myApp">
<head>
<title>DWAS</title>
</head>
<body ng-controller="IndexCtrl">
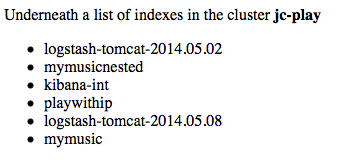
<p>Underneath a list of indexes in the cluster <strong>${clusterName?html}</strong></p>
<div ng-init="initIndexes()">
<ul>
<li ng-repeat="index in indexes">{{index.name}}</li>
</ul>
</div>
<script src="/assets/js/angular-1.2.16.min.js"></script>
<script src="/assets/js/app.js"></script>
</body>
</html>
By default you put these template in the resources folder using the same sub folders as your view class has for the package. If you look closely you see some angularjs code, more on this later on. First we need to map a url to the view. This is done with a resource class. The following code block shows the HomeResource class that maps the “/” to the HomeView.
@Path("/")
@Produces(MediaType.TEXT_HTML)
public class HomeResource {
    private String clusterName;

    public HomeResource(String clusterName) {
        this.clusterName = clusterName;
    }

    @GET
    public HomeView goHome() {
        return new HomeView(clusterName);
    }
}
Notice we now configure it to return text/html. The goHome method is annotated with GET, so each GET request to the PATH “/” is mapped to the HomeView class. Now we need to tell jersey about this mapping. That is done in the runner class.
final HomeResource homeResource = new HomeResource(config.getClusterName());
environment.jersey().register(homeResource);
Using assets
The final part I want to show is how to use the assets bundle from drop zone to map a folder “/assets” to a part of the url. To use this bundle you have to add the following dependency in maven: dropwizard-assets. Than we can easily map the assets folder in our resources folder to the web assets folder
    @Override
    public void initialize(Bootstrap<DWESConfiguration> dwesConfigurationBootstrap) {
        dwesConfigurationBootstrap.addBundle(new ViewBundle());
        dwesConfigurationBootstrap.addBundle(new AssetsBundle("/assets/", "/assets/"));
    }
That is it, now you can load the angular javascript file. My very basic sample has one angular controller. This controller uses the $http service to call our /indexes url. The result is used to show the indexes in a list view.
myApp.controller('IndexCtrl', function ($scope, $http) {
    $scope.indexes = [];

    $scope.initIndexes = function () {
        $http.get('/indexes').success(function (data) {
            $scope.indexes = data;
        });
    };
});
And the result
Concluding
This was my first go at using drop wizard, I must admit I like what I have seen so far. Not sure if I would create a big application with it, on the other hand it is really structured. Before moving on I would need to reed a bit more about the library and check all of its options. There is a lot more possible than what I have showed you in here.
References
- My github page for this project
- Getting Started guide for Dropwizard
- Dropwizard Elasticsearch Sample on Github
- Good place to start to read more about Dropwizard
I was just looking for the same combination (drop wizard + elasticsearch). Thanks for your contribution. I will try it and let you know my experience.
Thanks for this article. Currently also what I am trying to do i.e. dropwizard backend and angularjs ui in same project.
I do not manage to make angularjs routing work with this though. Seems like it collides with dropwizard intercepting all…
Any ideas?
Hmm, no not yet, try to have a look at it the coming days.
Hi if you check my github repo you can find an updated version using routing.
https://github.com/jettro/dropwizard-elastic
regards jettro