![]() As a programmer you are writing code. As a designer you are creating solid designs and if you are wise, the code is a good reflection of your design. My previous post was about Domain Driven Design. One of the things I want to repeat is the strong relation between the domain, the design and the code. The best way to accomplish this is to combine the role of designer and implementer. That way you get the best representation of the domain in your solution.
As a programmer you are writing code. As a designer you are creating solid designs and if you are wise, the code is a good reflection of your design. My previous post was about Domain Driven Design. One of the things I want to repeat is the strong relation between the domain, the design and the code. The best way to accomplish this is to combine the role of designer and implementer. That way you get the best representation of the domain in your solution.
Why this introduction, when I promised to write about performance and monitoring? For performance I see the same relationship. A tester creates the test plan, including the performance test. If you are lucky requirements for monitoring are available as well. Ok, I do not want to combine the role of tester and developer. Still they should both have a very good idea about what the other one does and how you can help each other. Real performance testing is hard and should not be taken to light. Monitoring however can be done on a low level during development. How often have you written log statements like: This method X is executed. Sometimes with a start and end time. Some of you might have used there own aspects to be non intrusive and other might have used a framework.
This blog post is about using a framework to do basic performance measurement and monitoring. The framework I am going to discuss is the Beet framework.
Beet records user behavior and performance data for your Spring-based Java application. It can thus help you to analyze usage patterns and research production performance issues.
Read on to learn about my experiences with the framework and why I like it to do some basic monitoring.
What does it do?
I am not going to enlist all features, go to the website to find out what it can do for you. Here are some of the features that I like:
- Very nice integration with spring framework including namespace support.
- Manager that does logging of events using a memory and flush mechanism.
- Easy configuration to write the logs to disk or database.
- Use a binary format for events that is very condensed together with utilities to generate readable xml, csv or database inserts.
- Easy http-request monitoring
- JMX integration, switching monitoring on and off
- Good user manual and well written and documented code.
What does it look like?
I am using the code of yourscrum to experiment with Beet. Check out the code if you want to follow a long.![]()
Before you can use Beet, you have to download it. Luckily it is available in a maven repository. More information about the repository and the dependency can be found on the beet download page. For my sample I only included the beet artifact. I downloaded the utils (more on those later) as a tar file. You can find the downloads here: http://sourceforge.net/projects/beet/files/.
Now we have Beet available, we should add the namespace defintion to the spring configuration and the first very basic tracking manager to track all http-requests.
<?xml version="1.0" encoding="UTF-8"?>
<beans xmlns="http://www.springframework.org/schema/beans"
xmlns:xsi="http://www.w3.org/2001/XMLSchema-instance"
xmlns:context="http://www.springframework.org/schema/context"
xmlns:bt="http://www.mantis-tgi.com/schema/bt/1.1"
xmlns:aop="http://www.springframework.org/schema/aop"
xsi:schemaLocation="
http://www.springframework.org/schema/beans http://www.springframework.org/schema/beans/spring-beans-2.5.xsd
http://www.springframework.org/schema/context http://www.springframework.org/schema/context/spring-context-2.5.xsd
http://www.mantis-tgi.com/schema/bt/1.1 http://www.mantis-tgi.com/schema/bt/mtgi-bt-1.1.xsd
http://www.springframework.org/schema/aop http://www.springframework.org/schema/aop/spring-aop-2.5.xsd">
<bean class="org.springframework.beans.factory.config.PropertyPlaceholderConfigurer"/>
...
<bt:manager id="defaultTrackingManager"
application="yourscrum"
register-mbeans="false"
flush-schedule="0/30 * * * * ?">
<bt:xml-persister binary="true" compress="true" file="${log.dir}/beet-yourscrum-perf.xml"/>
<bt:http-requests parameters="dispatch"/>
</bt:manager>
...
</beans
[/sourcecode]
<p>There are a few things to learn from this confguration. First that we are logging in a binary format and compressed. This is not handy when you are trying to read the logs at runtime. Therefore you have the option to change this. The result is a nice readable XML formatted file. Other interesting things are the http_request configuration and the flush schedule. The flush schedule is used to cache logs and send them to the file only every 30 seconds in our case.</p>
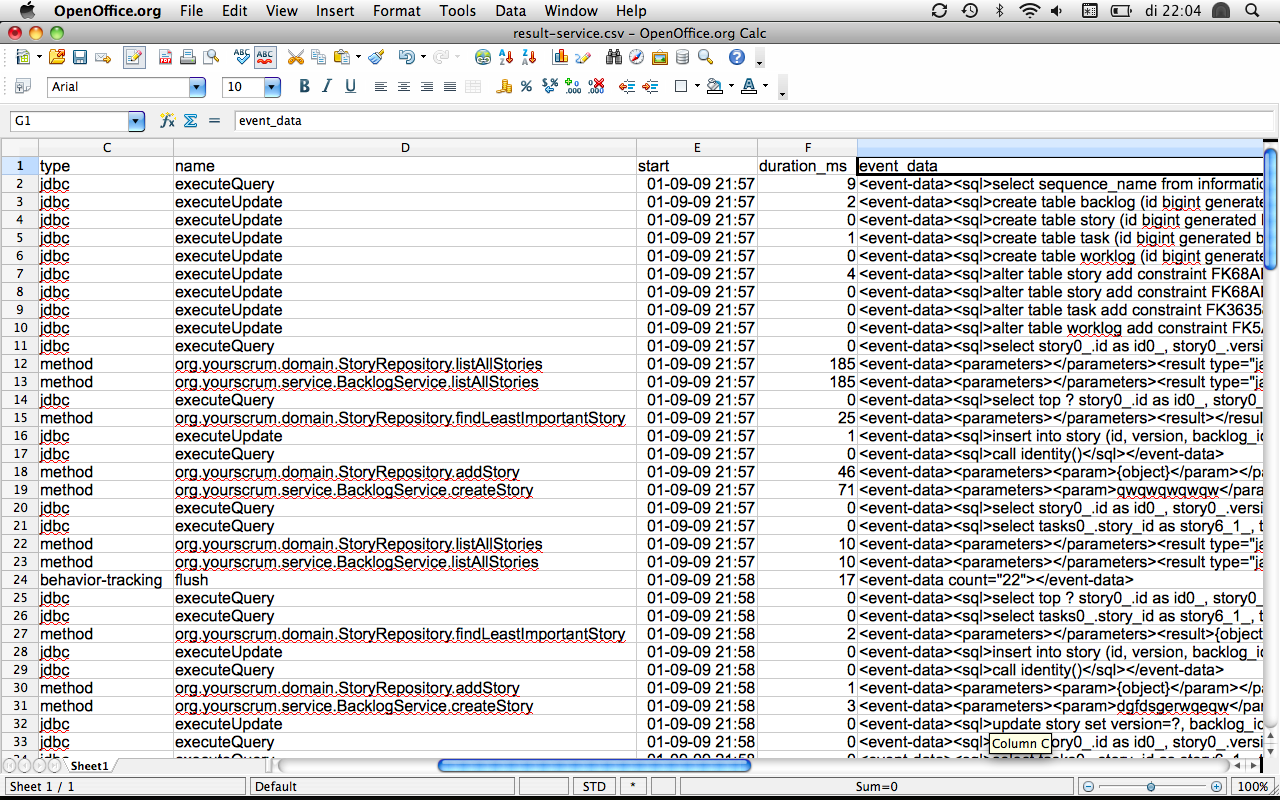
<p>If you choose for the binary format, you need to use the beet-utils to extract the data into a csv file, readable xml or database calls. There is a basic command that you can use to uncompress and transform the data.</p>
<pre>
gzcat ./beet-yourscrum-perf.bxml.gz | java -jar /path/to/beet-utils.jar -tool csv > result.csv
</pre>
<p>The *.bxml.gz is the binary data file. Beware that the original documentation explains the use of zcat. For me on the mac I had to use the older gzcat tool. But the commands are the same. The following image shows the results in csv format.</p>
<a href="/wp-content/uploads/Screen-shot-2009-08-30-at-09.19.53.png" rel="lightbox"><img src="/wp-content/uploads/Screen-shot-2009-08-30-at-09.19.53-150x150.png" alt="Screen shot 2009-08-30 at 09.19.53.png" border="0" width="150" height="150" align="right" /></a>
<p>Next up is to configure method access.</p>
<h3>Can we monitor method calls?</h3>
<p>Of course we can track method calls. Actually Beet makes it very easy for you. The manager namespace has an attribute called track-method-expression. You can provided it with any pointcut expression and you are done.</p>
<p>There are two buts when using pointcuts. But 1, you want to use one tracking manager but multiple pointcuts. One to monitor services and one to monitor controllers. Beet provides a mechanism to create separate advisors and pointcuts. There is a small bug in the 1.4.0-b3 release that prevents your from using this though. But 2, think about the way spring treats multiple configuration files. One loaded by the web context (servlet) and the other by the application context (listener). Pointcuts can not overcome these context boundaries, therefore we need multiple tracking managers at the moment.</p>
<p>The code looks like this, check thetrack-method-expression</p>
[sourcecode language='xml']
<bt:manager id="webTrackingManager"
application="yourscrum"
register-mbeans="false"
track-method-expression="execution(* org.yourscrum.web.story.*Controller.*(..))"
flush-schedule="0/30 * * * * ?">
<bt:xml-persister binary="true" compress="true" file="${log.dir}/beet-yourscrum-web-perf.xml"/>
<bt:http-requests parameters="dispatch"/>
</bt:manager>
Are there other things to monitor?
Beet does provided some other helpful beans to monitor your application. A nice one is the datasource monitor. Very easy to configure. Just add an attribute to the datasource configuration. You can look at the following code block for an example. After that there is again an image with some sample csv data.
    <bean id="dataSource" class="org.springframework.jdbc.datasource.DriverManagerDataSource"
          bt:tracking-manager="serviceTrackingManager">

        <property name="driverClassName" value="${jdbc.driverclass}"/>
        <property name="url" value="${jdbc.url}"/>
        <property name="username" value="${jdbc.username}"/>
        <property name="password" value="${jdbc.password}"/>
    </bean>
What could be improved?
Before I sound to negative I do like to mention that Jason responded fast to the issues I found. Still others can find them as well, let’s help Jason to fix the issues and improve the project. I think it is worth it.
- Problem configuring pointcuts and separate advise. The manager accepts an pointcut expression for tracking method calls. It is also possible to create you own pointcuts and combine them with existing pointcuts. That way you can combine it with transaction creation for instance. The fix does not look very hard, the issue is logged.
- Problems logging to one file with one manager when the spring configuration is split up into multiple files and multiple contexts loaded by the servlet and the listener. To create a solution for this problem we need the pointcut option as mentioned in the previous point and preferably a separate bean for the http-request listener that is connected to the tracking manager at the moment. The issues are mentioned and a solution will be created.
- The last point depends on your taste, to me it is a big problem. The project uses GIT for source control. I had never worked with it and needed to configure it on my machine to extract the sources from the repository. But the bigger problem is ant and ivy. Man I do not like this. I just love the maven integration in my IDE and the project setup. This project is not easy to open in a real IDE like intellij. But again, that is a matter of taste.
Conclusion
I can say I am going to experiment more with this framework. It looks very promising. A few small issues need to be fixed. I am planning on using it for a bit bigger project to see how it holds up.
I am curious to learn from you about the frameworks that you use for performance testing and monitoring. Drop me a line or a comment.